Overview
The home dashboard in the Spread app is a summary screen where you can see your email performance and lead engagement at a glance.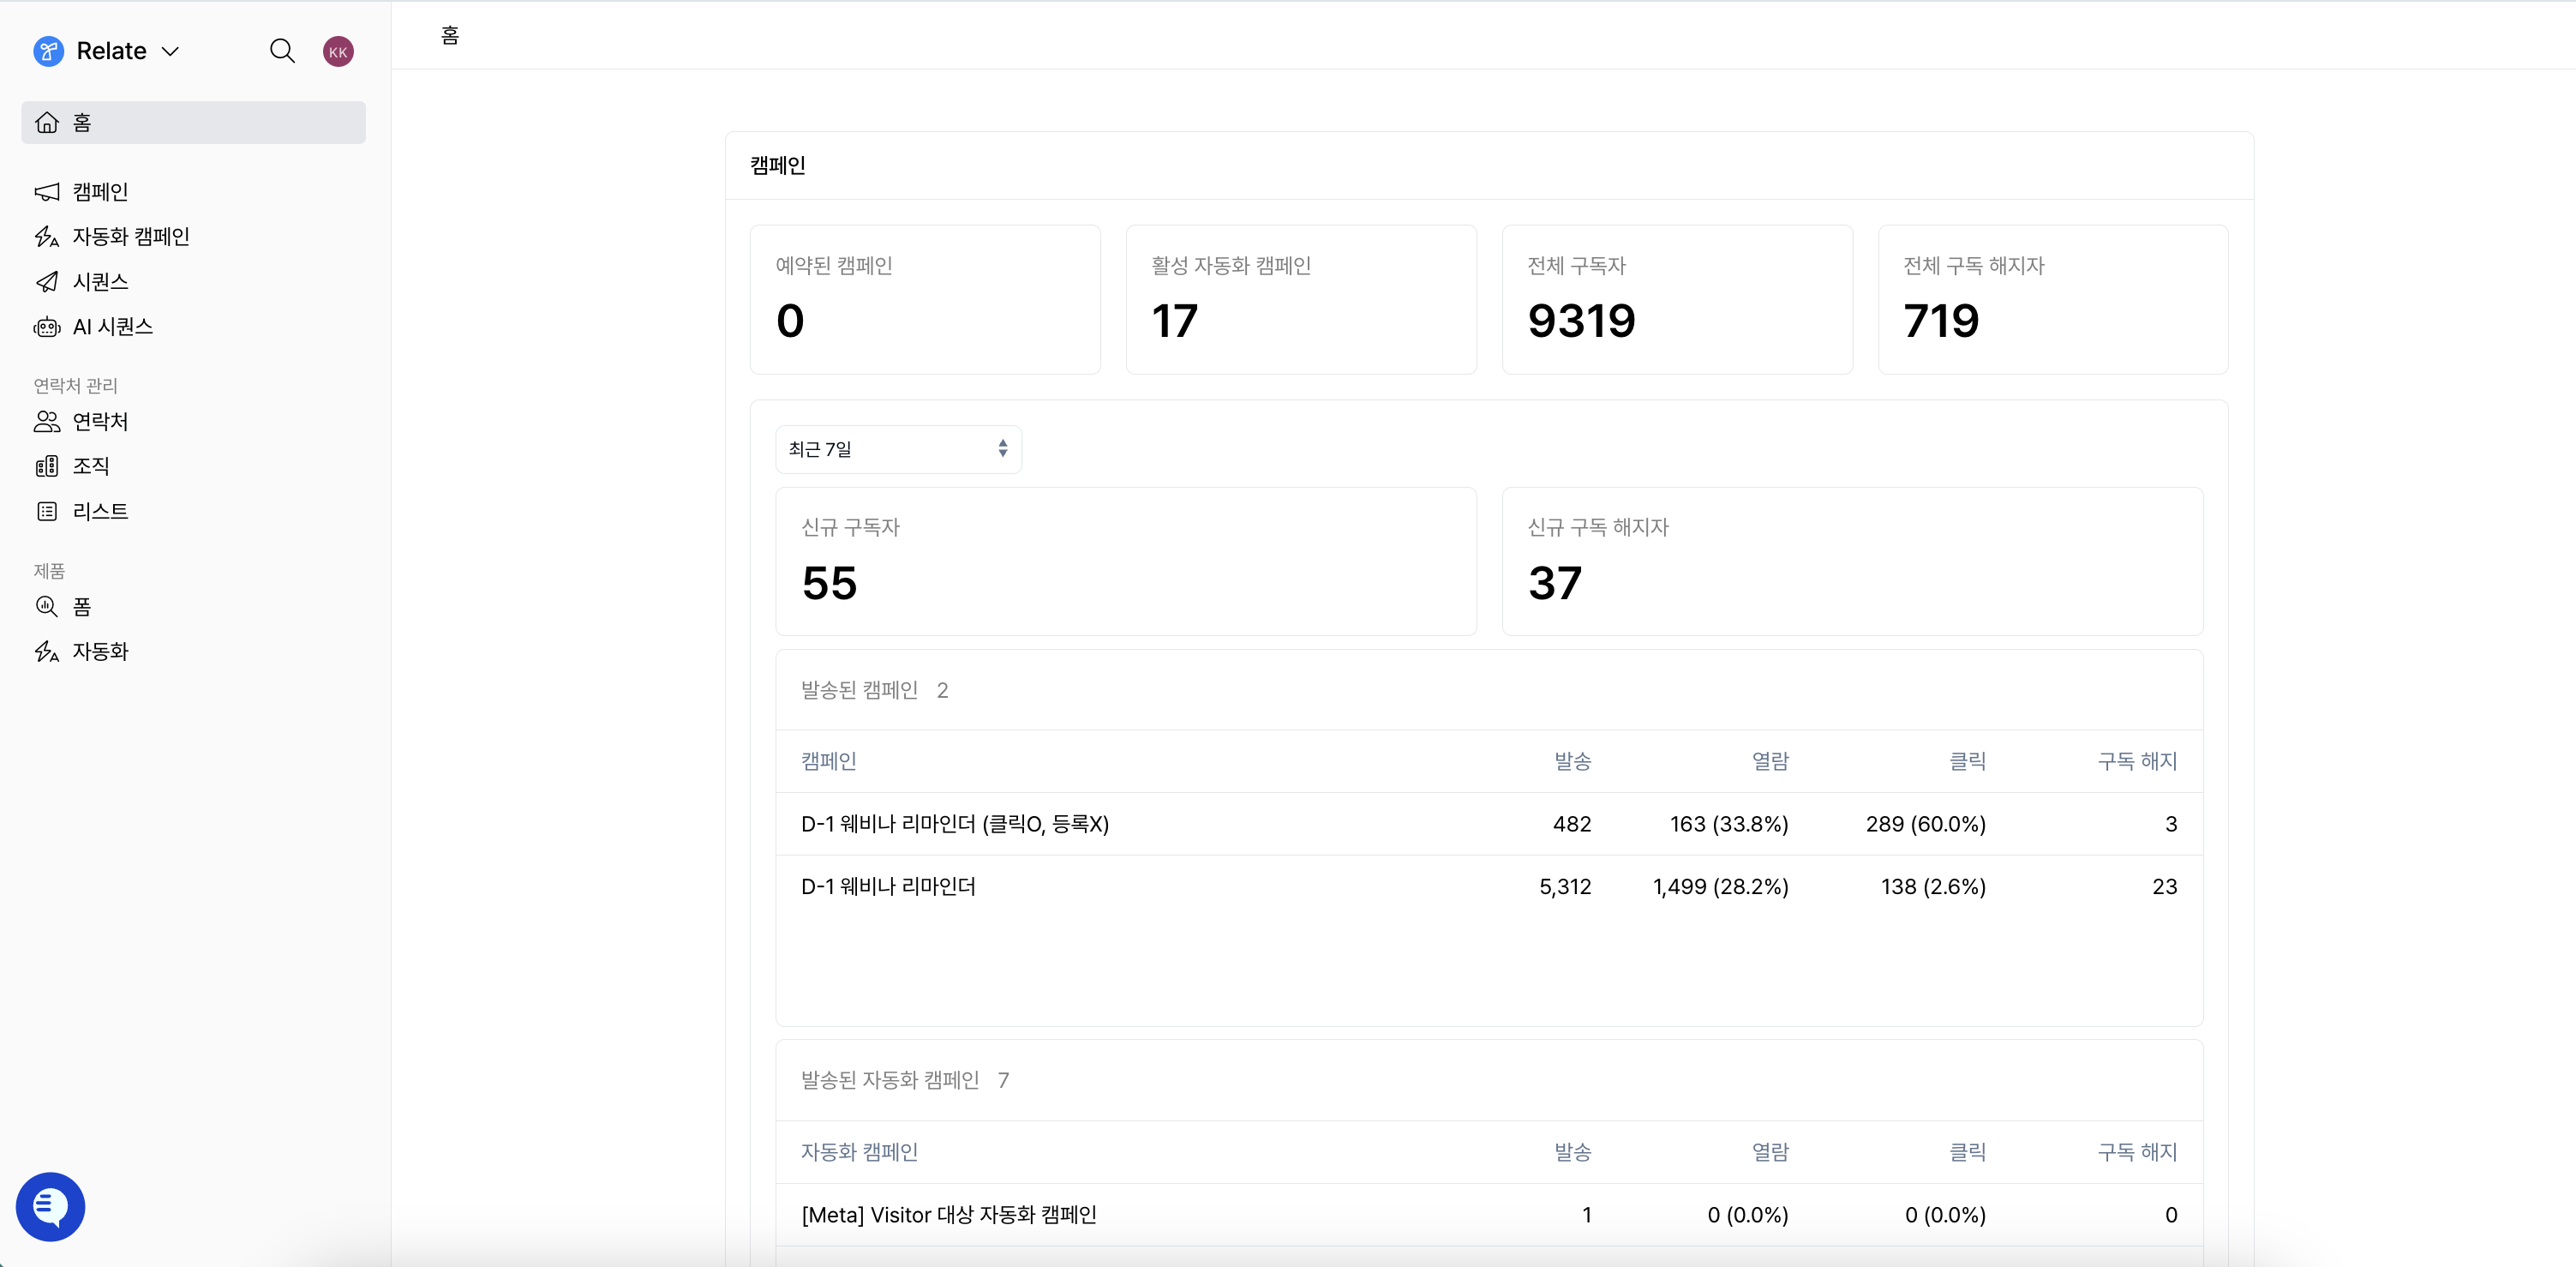
- Campaigns & Triggered Campaigns area: Review the performance of bulk campaigns and triggered campaigns.
- Sequences area: Review the performance of sequence emails sent 1:1 or step by step.
Campaigns & Triggered Campaigns
This area gives you a comprehensive view of the overall performance of your campaigns and triggered campaigns.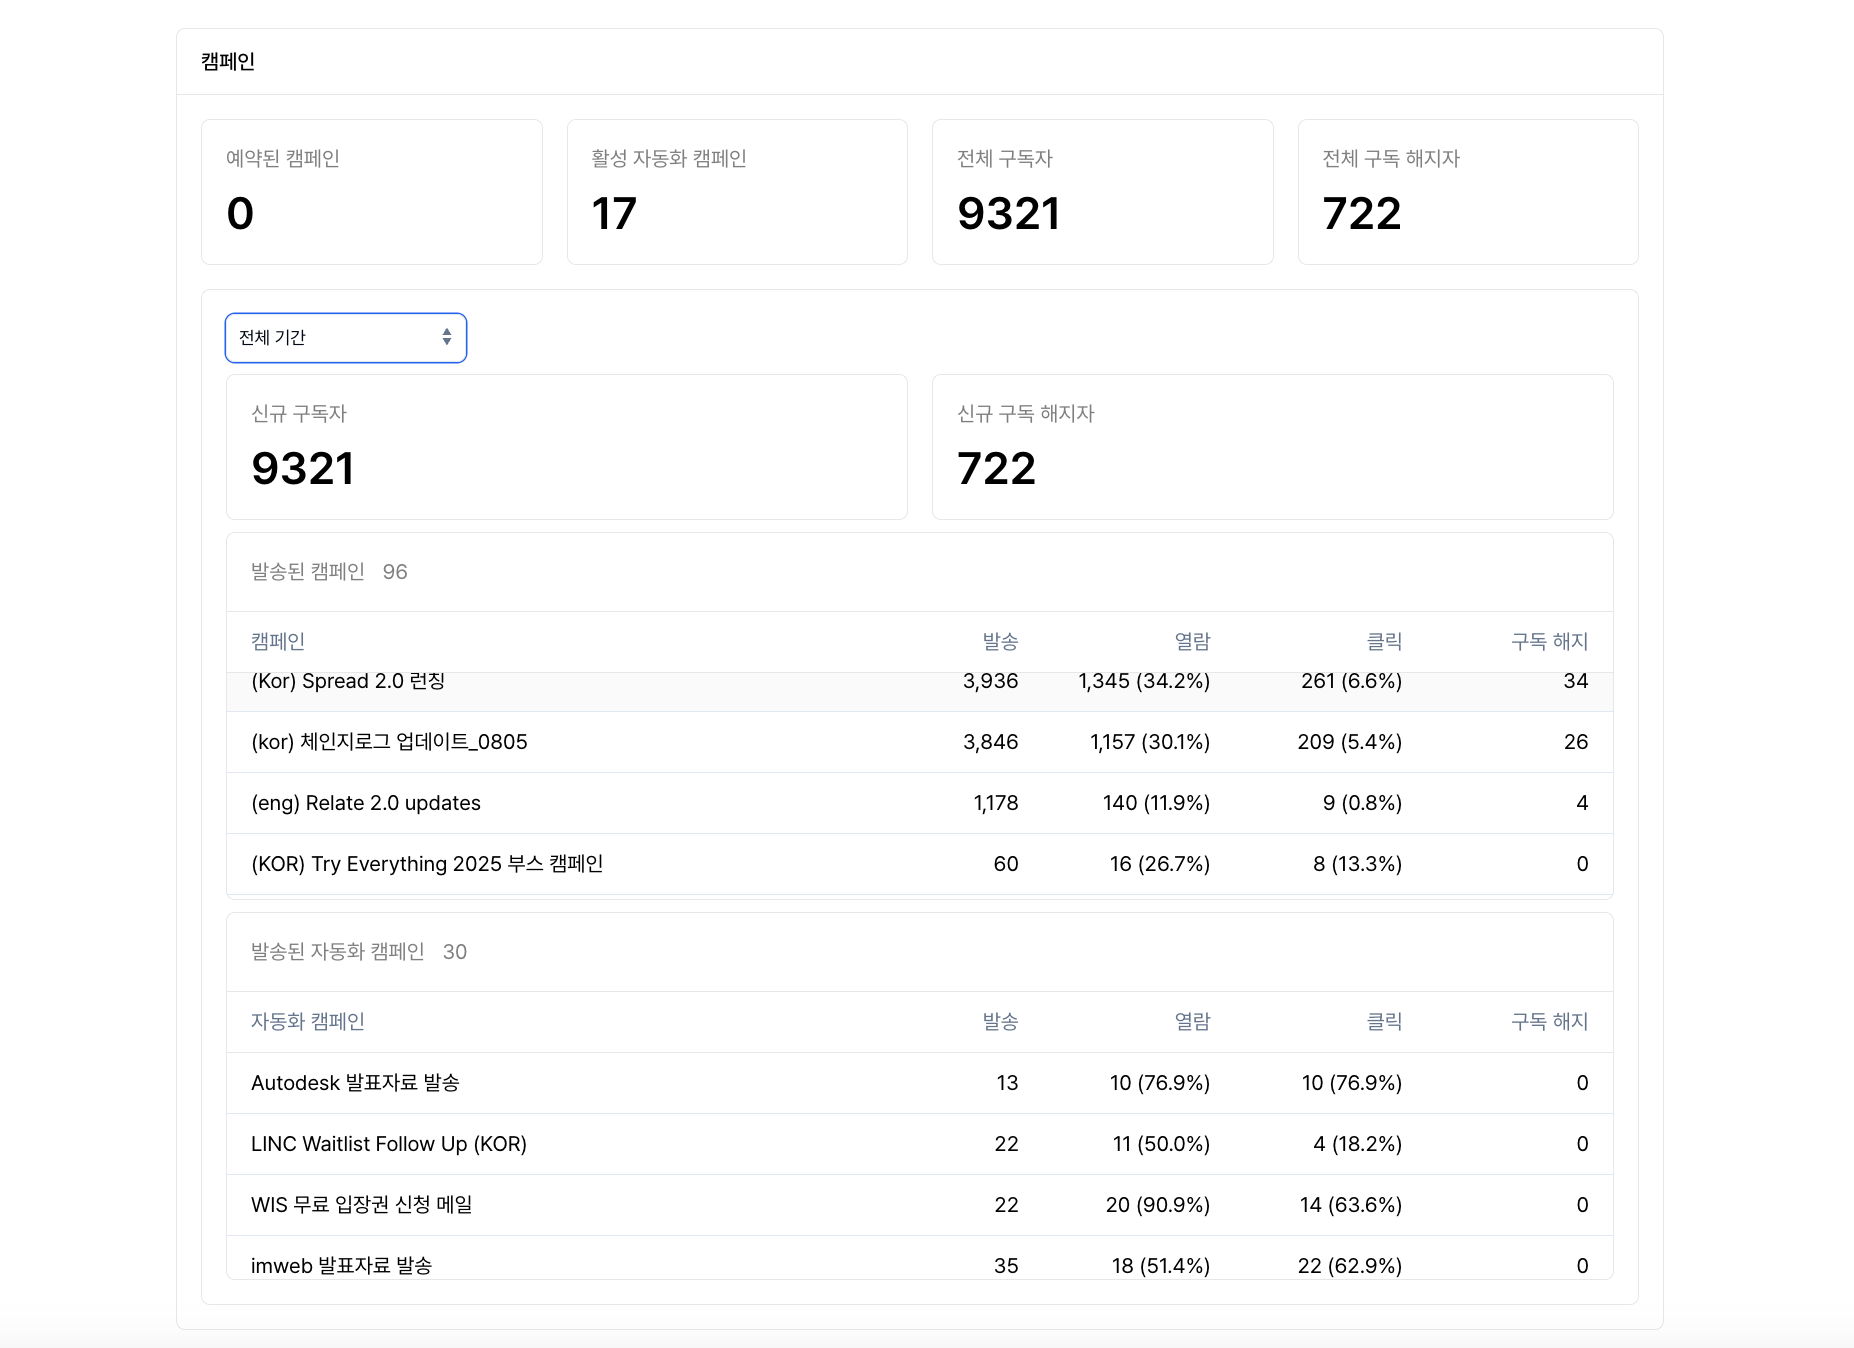
Top summary metrics
- Scheduled campaigns: The number of campaigns that haven’t been sent yet and are scheduled.
- Active triggered campaigns: The number of triggered campaigns currently running.
- Total subscribers: The total number of contacts who have consented to receive emails.
- Total unsubscribes: The total number of contacts who have unsubscribed so far.
Subscriber changes over time
- New subscribers: The number of contacts who newly subscribed during the selected period.
- New unsubscribes: The number of contacts who unsubscribed during the selected period.
Campaign / triggered campaign performance over time
In the list of sent campaigns / triggered campaigns, you can review and compare the performance of each campaign.- Sent: The number of emails actually sent. This does not include failed or bounced emails.
- Opens: The number of email opens and the open rate (%).
- Clicks: The number of link clicks within emails and the click rate (%).
- Unsubscribes: The number of unsubscribes caused by that campaign.
Sequences
This area lets you review the performance of sequence emails sent 1:1 or step by step.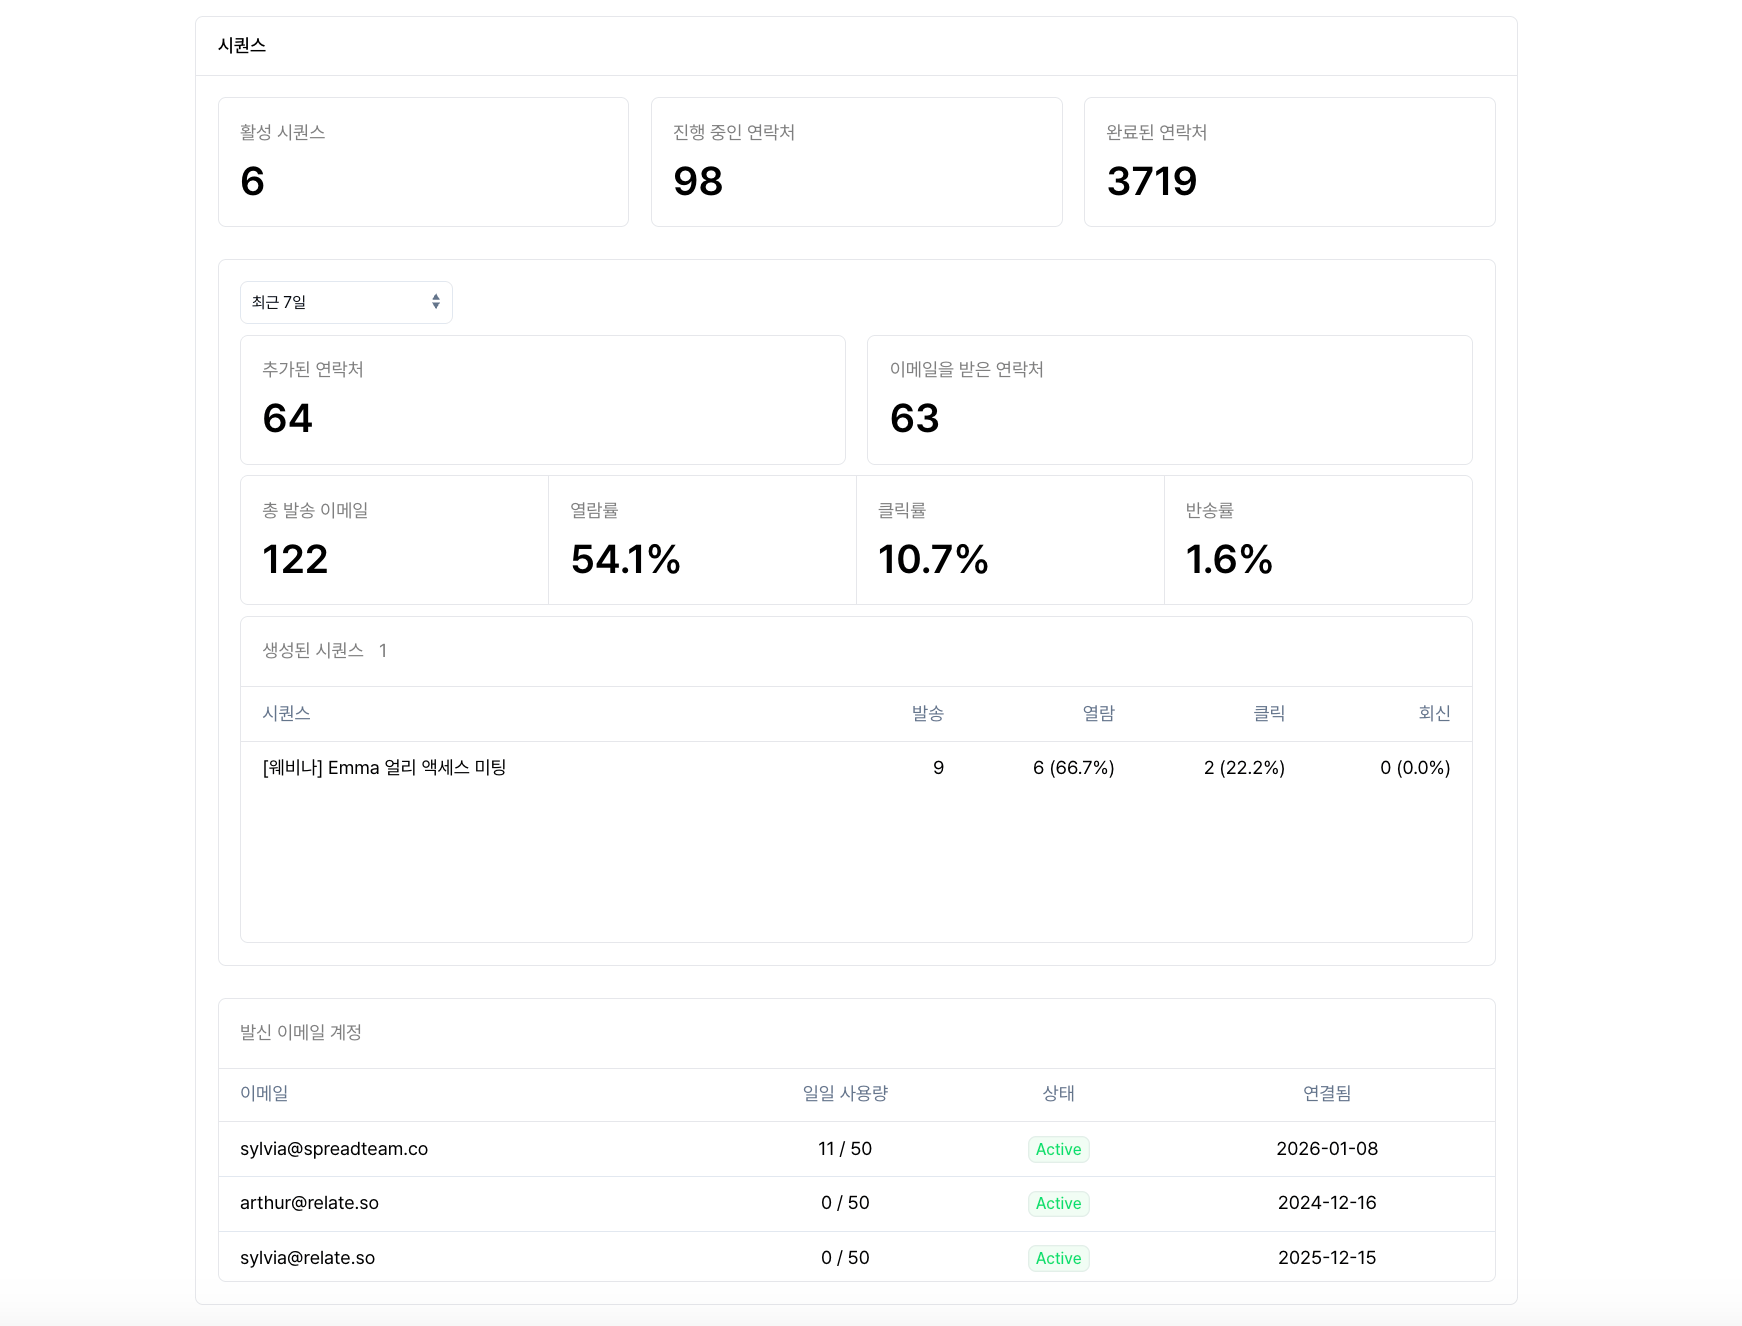
Top summary metrics
- Active sequences: The number of sequences currently running.
- In-progress contacts: The number of contacts currently in a sequence and receiving emails.
- Completed contacts: The number of contacts who have completed the entire sequence.
Contact changes over time
- Added contacts: The number of contacts newly added to sequences during the selected period.
-
Contacts that received emails: The number of contacts to whom sequence emails were sent successfully during the selected period. Emails in
failed,canceled, orrejectedstatus are not included.
Sequence performance over time
- Total emails sent: The total number of emails sent through sequences.
- Open rate: The percentage of sent emails that were opened.
- Click rate: The percentage of emails in which a link was clicked.
- Bounce rate: The percentage of emails that bounced because the email address was invalid.
Created sequence performance
In the sequence list at the bottom, you can review the following for each sequence.- Sent
- Opens and open rate
- Clicks and click rate
- Replies and reply rate
Tips for using the dashboard
- Compare campaign performance: use the period filter to see changes versus the previous week/month.
- Track lead engagement: find segments with high opens/clicks and optimize your messaging.
- Manage lists: monitor unsubscribe trends to check your content quality.