> ## Documentation Index
> Fetch the complete documentation index at: https://www.spread.so/docs/llms.txt
> Use this file to discover all available pages before exploring further.
# Understanding the Spread Dashboard
> Understand the key metrics and layout available in the Spread dashboard.
## Overview
The home dashboard in the Spread app is a summary screen where you can see your email performance and lead engagement at a glance.
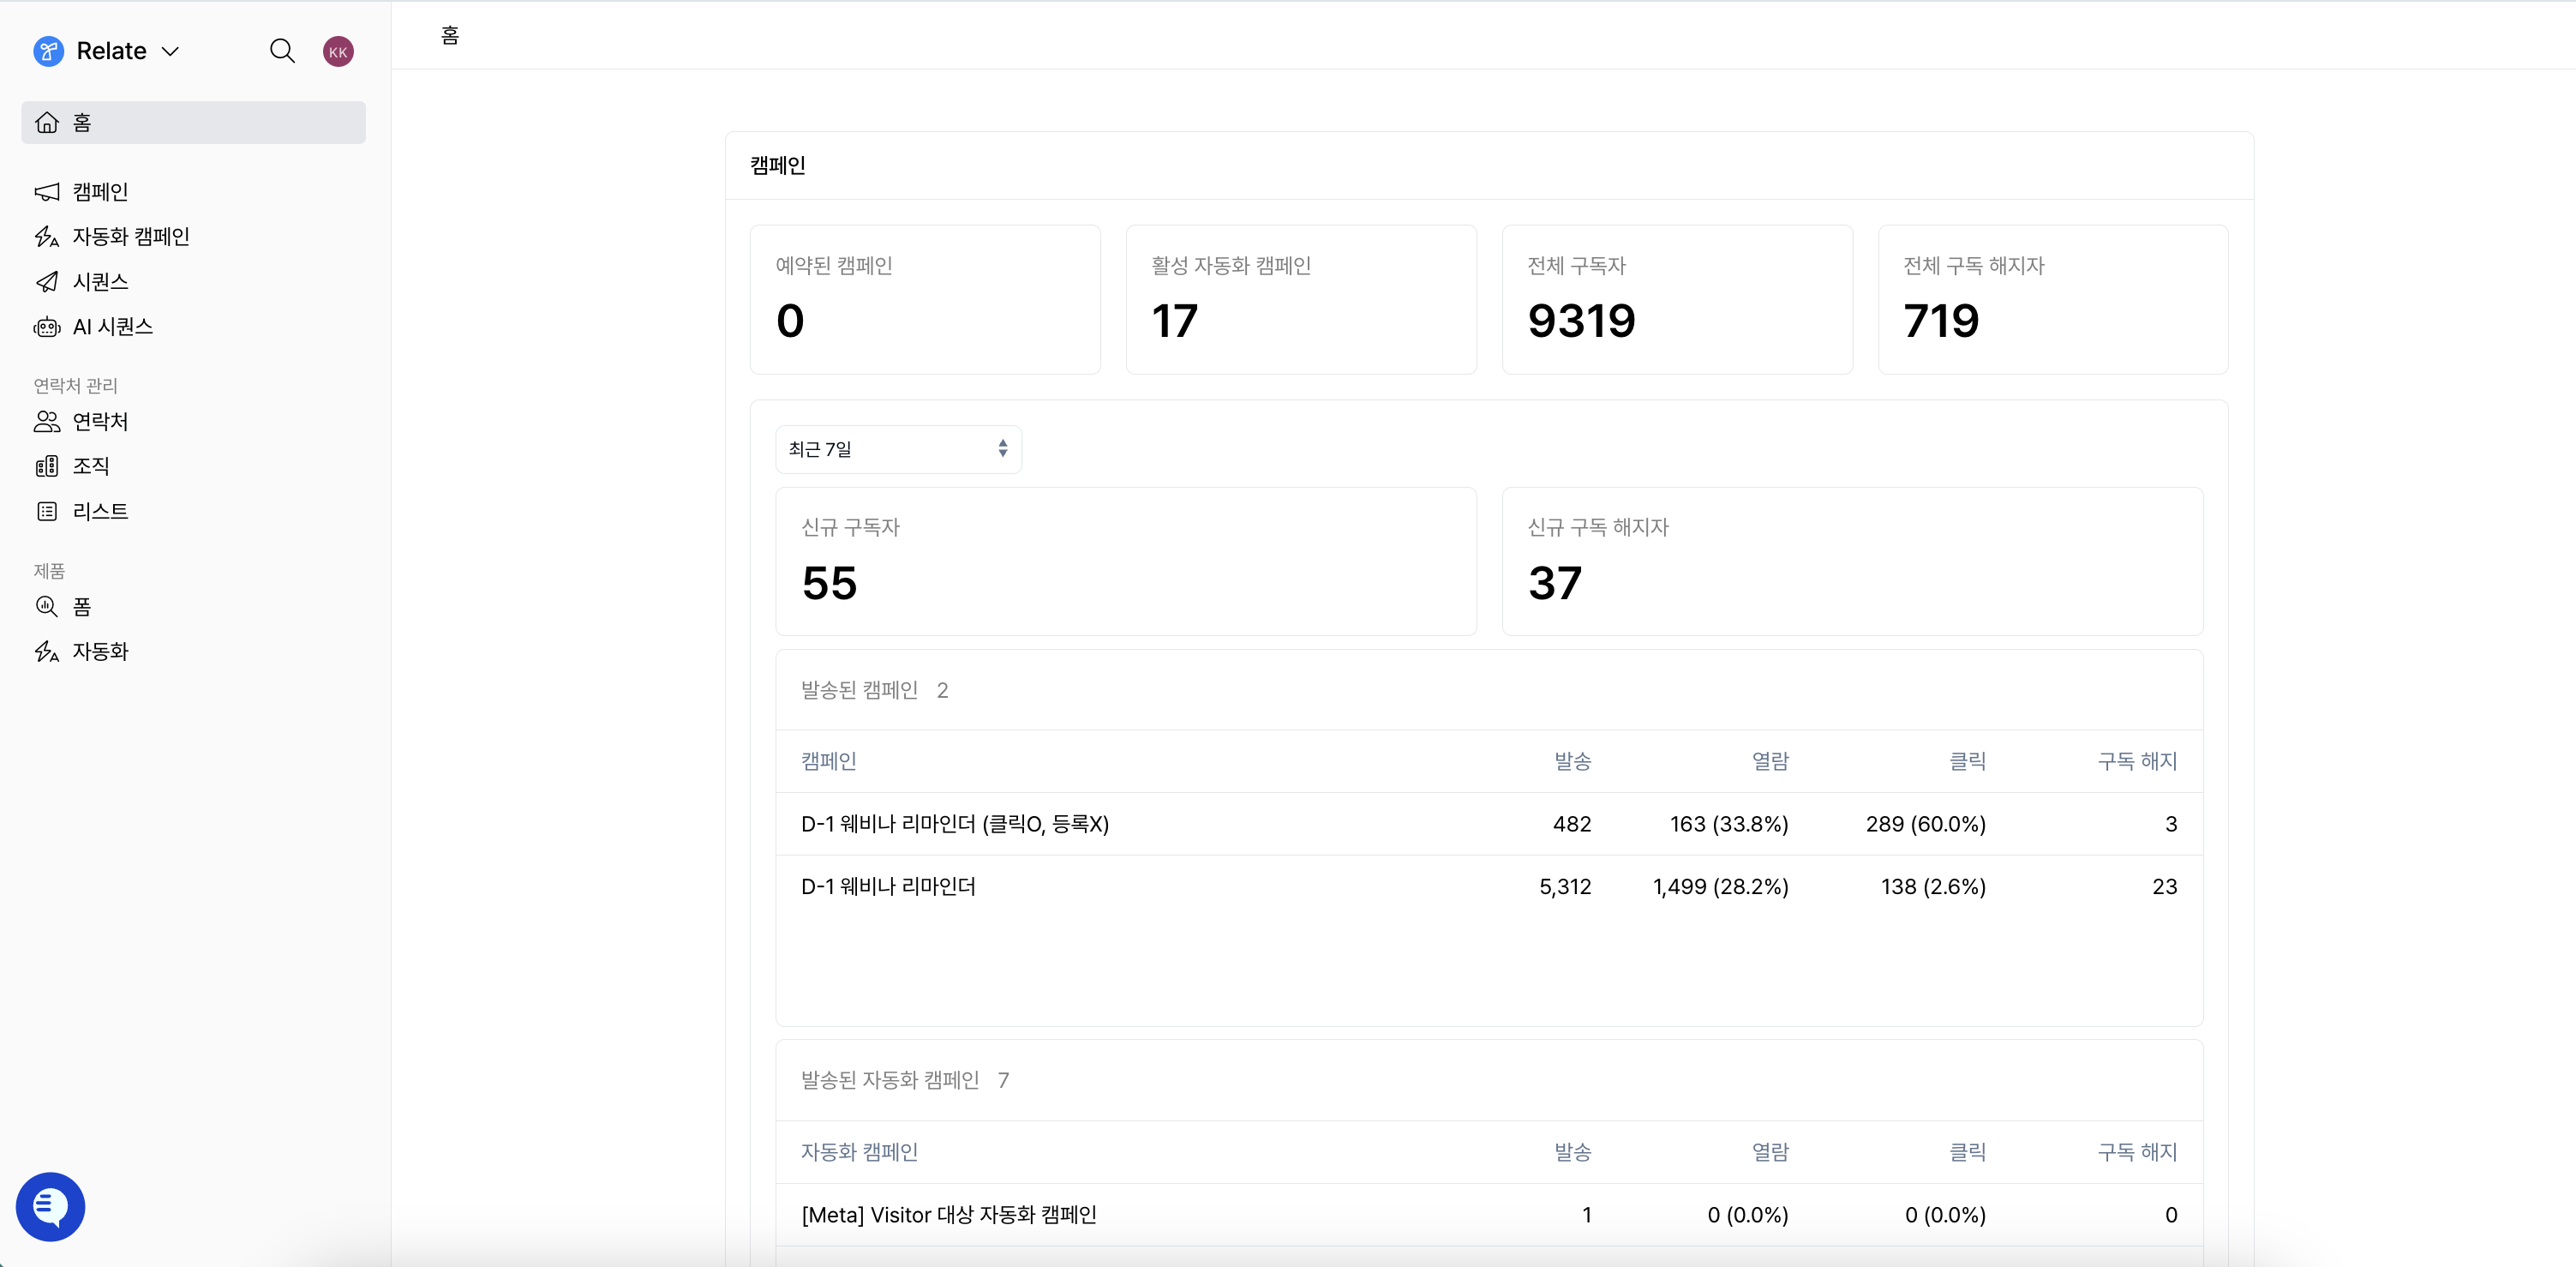 The dashboard is divided into two main areas.
* [**Campaigns & Triggered Campaigns**](/docs/spread-email-types#one-off-campaigns) **area**: Review the performance of bulk campaigns and triggered campaigns.
* [**Sequences**](/docs/spread-email-types#sequences) **area**: Review the performance of sequence emails sent 1:1 or step by step.
The dashboard is divided into two main areas.
* [**Campaigns & Triggered Campaigns**](/docs/spread-email-types#one-off-campaigns) **area**: Review the performance of bulk campaigns and triggered campaigns.
* [**Sequences**](/docs/spread-email-types#sequences) **area**: Review the performance of sequence emails sent 1:1 or step by step.
The dashboard is for quickly checking your overall performance.\
To review the send results, status, and engagement of each individual email in detail, see the
[Email Metrics](/docs/metrics) guide.
***
## Campaigns & Triggered Campaigns
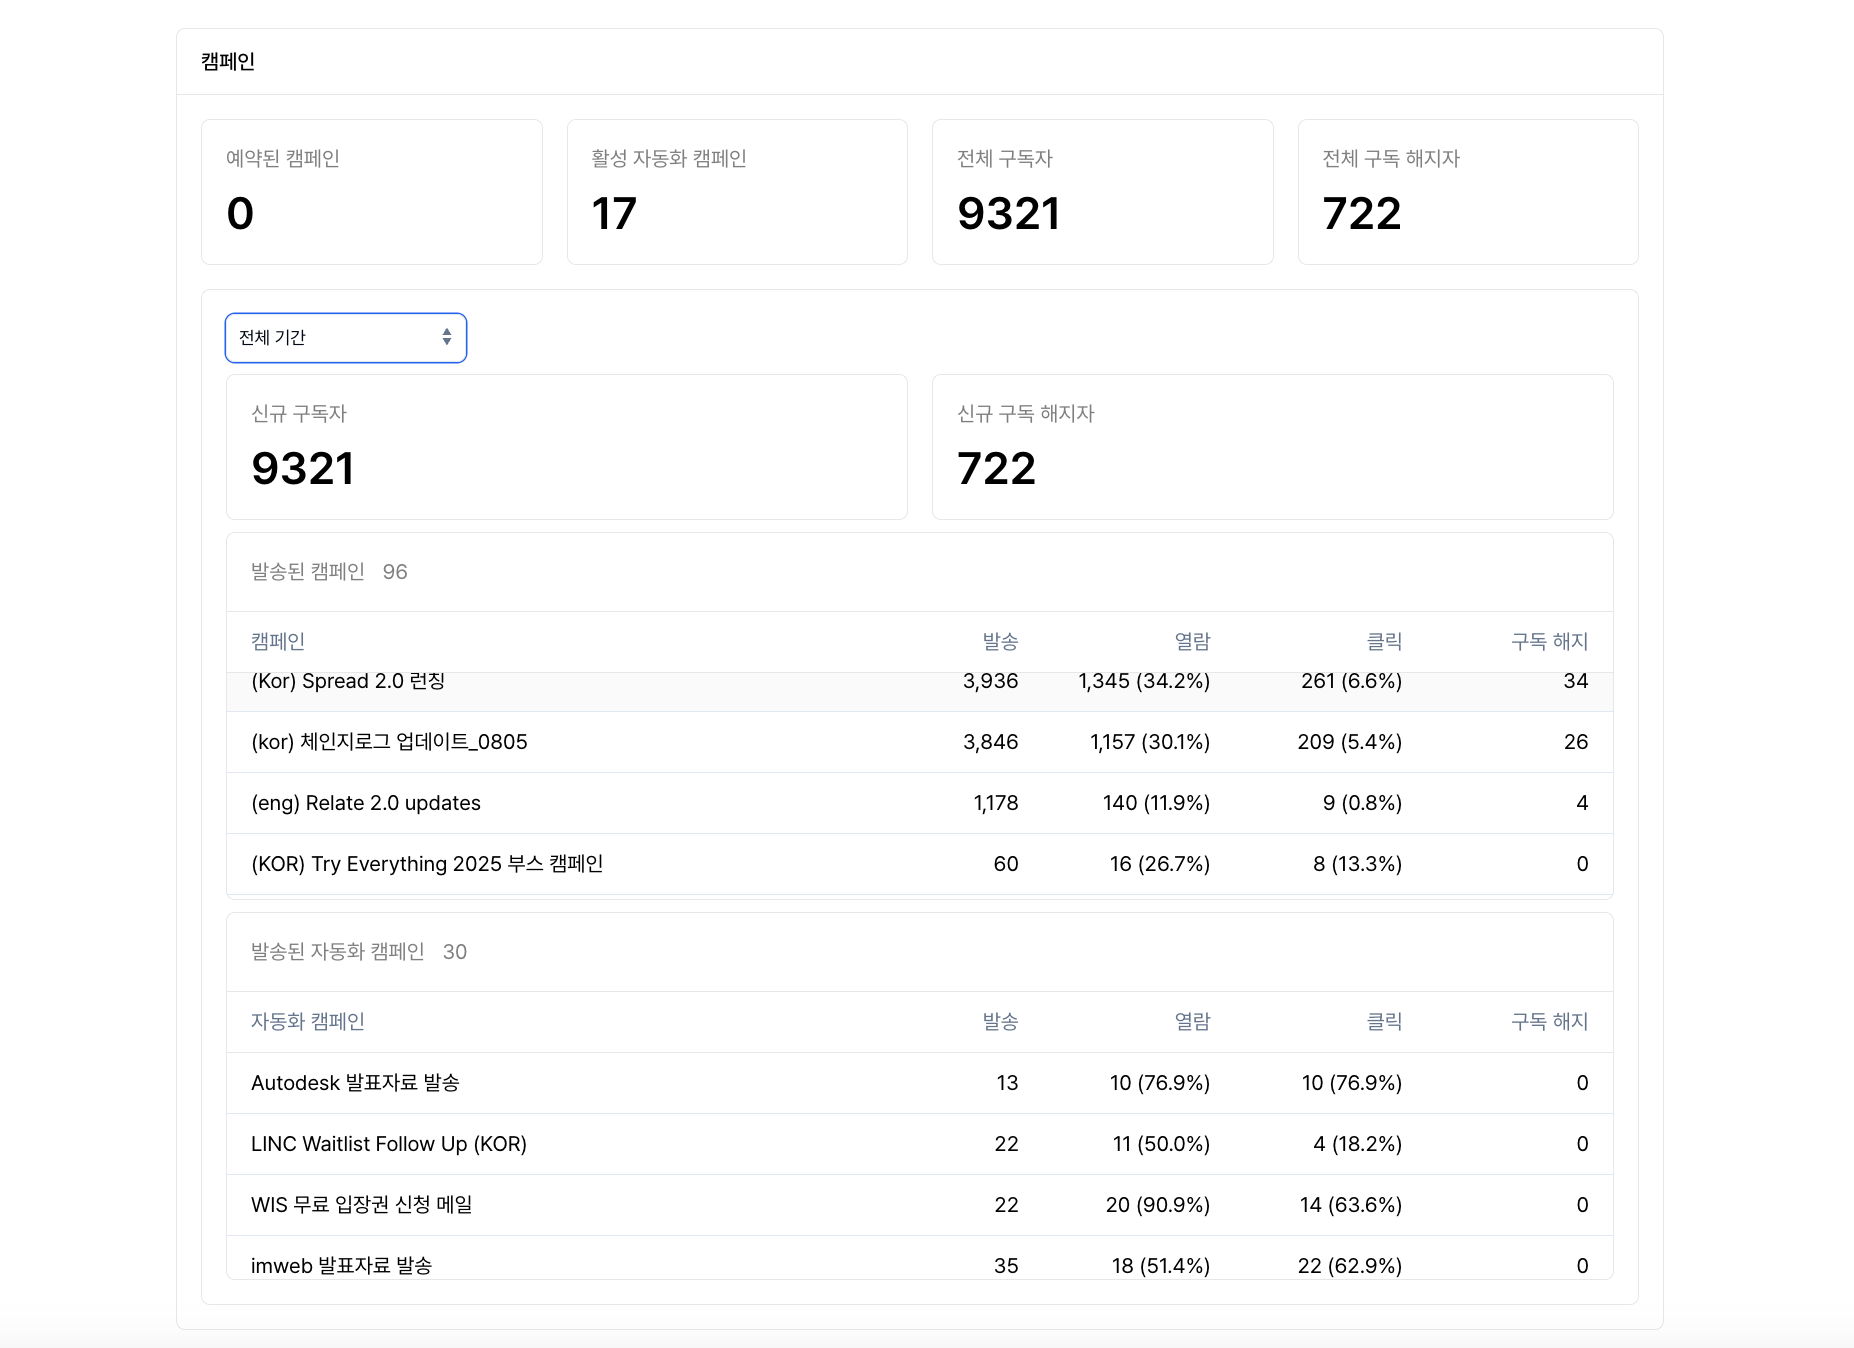
This area gives you a comprehensive view of the overall performance of your campaigns and triggered campaigns.
### Top summary metrics
* **Scheduled campaigns**: The number of campaigns that haven't been sent yet and are scheduled.
* **Active triggered campaigns**: The number of triggered campaigns currently running.
* **Total subscribers**: The total number of contacts who have consented to receive emails.
* **Total unsubscribes**: The total number of contacts who have unsubscribed so far.
### Subscriber changes over time
* **New subscribers**: The number of contacts who newly subscribed during the selected period.
* **New unsubscribes**: The number of contacts who unsubscribed during the selected period.
These metrics let you understand subscriber growth and churn trends over a specific period.
### Campaign / triggered campaign performance over time
In the list of sent campaigns / triggered campaigns, you can review and compare the performance of each campaign.
* **Sent**: The number of emails actually sent. This does not include failed or bounced emails.
* **Opens**: The number of email opens and the open rate (%).
* **Clicks**: The number of link clicks within emails and the click rate (%).
* **Unsubscribes**: The number of unsubscribes caused by that campaign.
***
## Sequences
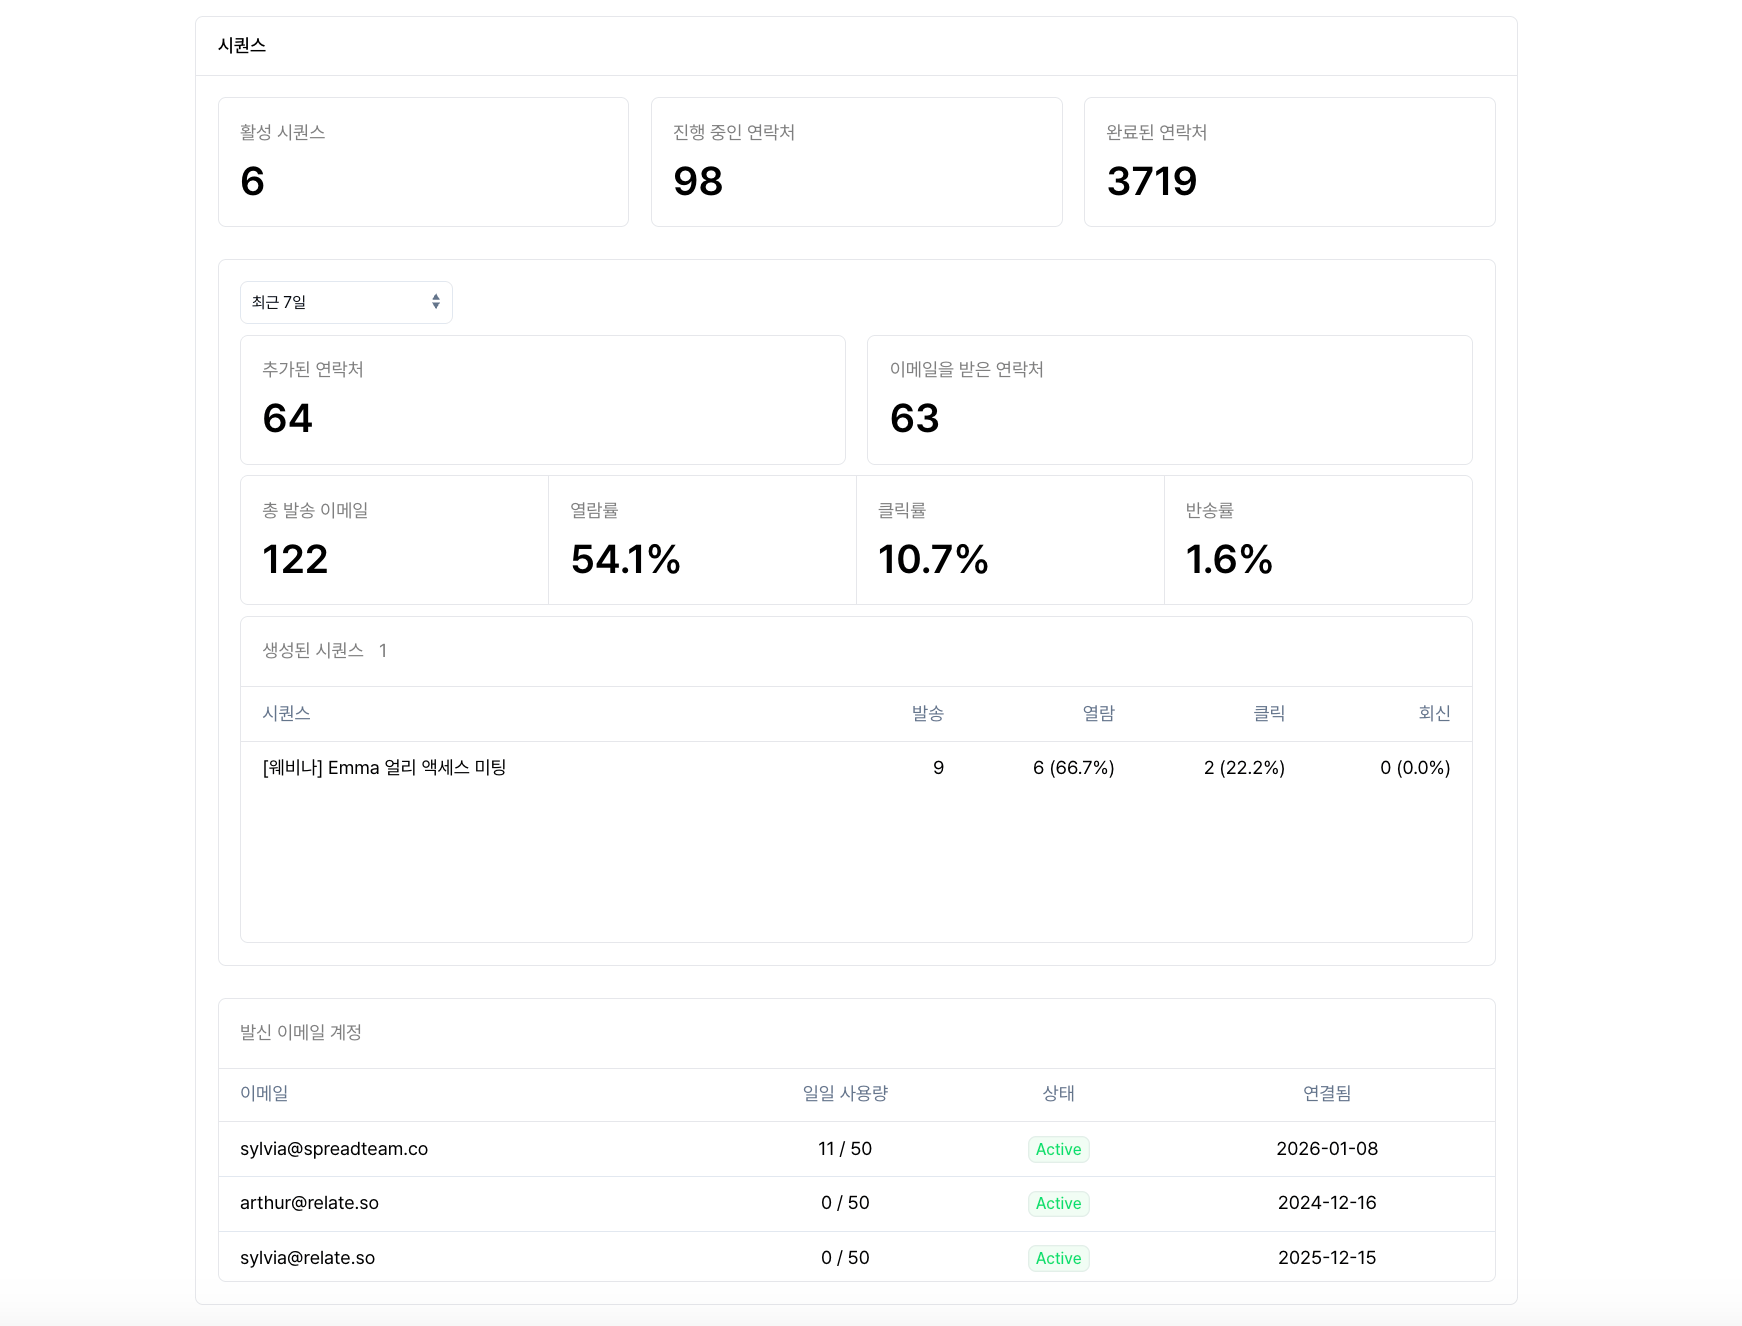
This area lets you review the performance of sequence emails sent 1:1 or step by step.
### Top summary metrics
* **Active sequences**: The number of sequences currently running.
* **In-progress contacts**: The number of contacts currently in a sequence and receiving emails.
* **Completed contacts**: The number of contacts who have completed the entire sequence.
### Contact changes over time
* **Added contacts**: The number of contacts newly added to sequences during the selected period.
* **Contacts that received emails**: The number of contacts to whom sequence emails were **sent successfully** during the selected period. Emails in `failed`, `canceled`, or `rejected` status are not included.
### Sequence performance over time
* **Total emails sent**: The total number of emails sent through sequences.
* **Open rate**: The percentage of sent emails that were opened.
* **Click rate**: The percentage of emails in which a link was clicked.
* **Bounce rate**: The percentage of emails that bounced because the email address was invalid.
### Created sequence performance
In the sequence list at the bottom, you can review the following for each sequence.
* **Sent**
* **Opens and open rate**
* **Clicks and click rate**
* **Replies and reply rate**
This helps you understand which sequences are actually leading to conversations.
***
## Tips for using the dashboard
* Compare campaign performance: use the period filter to see changes versus the previous week/month.
* Track lead engagement: find segments with high opens/clicks and optimize your messaging.
* Manage lists: monitor unsubscribe trends to check your content quality.